Sociodemographic: Number of Burns

In an earlier post, we compared income across burner populations, comparing veterans and virgins – for this post we focus directly on the number of years burners visited the Playa (data on regional events coming soon).

Burners were asked two similar questions about their years on the Playa:

  • How many times they’ve been to Burning Man
  • How long since their virgin year

This method captures the proportions of virgins each year well as acknowledges those veterans who have been here since the beginning.

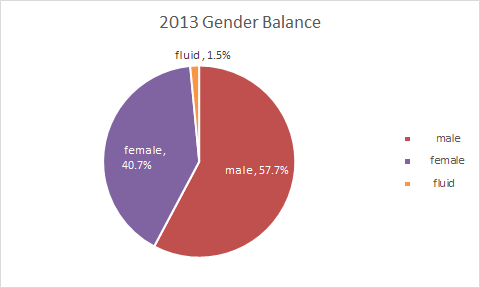
You’ll notice we replaced “zero” with “virgin” for both graphs. Virgins made up 40% of the population sampled.

 Number of Burns-image-2


For the number of burns attended, 20% of burners surveyed were visiting for their second year, followed by burners in their fourth to fifth year of attendance (14%). There were a decrease of 11% in attendees coming for their third time.

 Number of Burns-image-1

24% of burners surveyed returned to the Playa within 1-2 years of their virgin year, but note that this graph does not show consecutive visits, just time elapsed since that first visit. 14% of burners reported 3-4 years since they were virgins, followed by 10% citing 5-7 years. This trend continues on our graph: the longer it has been since the typical burner’s virgin year, the smaller portion they make up of Black Rock City’s population.


Does this trend signify people “getting over” burning man? As they grow older, do veteran Burners find other commitments competing with an annual journey to the Playa? How do burners who attend intermittently affect this data?


Written by:

Tabitha Palmer aka Tabicat

Edited by:

Alison aka LoveAli


Sociodemographic: Language

Socio-demographic Characteristics: First Language Other than English

Languages

2013 found a very diverse list of languages being spoken on the playa with English being the most prolific at 87%, and the remaining 13% comprised of 70 different origins.

The top five non-English list starts with Spanish as the second most spoken language at 1.84%, followed by French at 1.78%, Russian at 1.77%, other languages – which includes 50 different languages – at 1.77%, and finally German with 1.52%.

Language1213 (1)

This data shows the there was a slight increase in Russian language being used on the playa in comparison to 2012. Russian overtook German which was used more widely in 2012. Some speculate that this could be due to the art projects that were accepted from the correlating country. Further study into the relationship between art installations and the country of origin of the creators of the said projects could add some more insight to the fluctuations in languages spoken on the playa from year to year.

Written by:

Crow

Edited by:

Wendi Corbin Goulette

Sociodemographic: Education

The Playa seems to attract a largely educated population. This shouldn’t come as much of a surprise, but it could be a matter of pride. The following is a description of how well-educated your fellow burners are.

The comparison to general population is being limited to the United States as 82% of all burners claim the United States as their home country. Most of the information on the default population is limited to adults aged 25 years or older.

Education

43% of all burners have attained a Bachelor’s Degree, whereas only 30% of the national population can say the same.  That 30% is the highest level of Bachelor Degree attainment in the history of the United States. The only group doing better than burners as a whole is Asian Americans, who have slightly over 50% Bachelor’s Degree attainment.

When it comes to graduate degrees, the disparity is even greater. Nearly 25% of the burner population has attained a graduate degree, compared to 11% of the default world population*.

15% of the US population at large doesn’t possess a high-school diploma**. Only 1% of burners reported not attaining one. A heartening statistic indeed.

Ed-OtherDegrees

Furthermore, nearly 10% of the burner population possess a technical or vocational certificate; these might be considered the builders of our great city; gallantly donating their technical knowledge to create our beautiful temporary home year after year.

Of further interest is that 4% of us possess a healing certificate. A bonafide group of healers and givers enhancing the Playa experience for all of us.

What does all this really mean? Well, it clearly means we can consider our community a group of intelligent, educated folks who are working together toward building an alternate reality. Being ahead of the game certainly helps!

*http://www.nytimes.com/2012/02/24/education/census-finds-bachelors-degrees-at-record-level.html

**https://www.census.gov/prod/2012pubs/p20-566.pdf


Written by:

Priti Bali-Kahn

Edited by:

Wendi Corbin Goulette

Sociodemographic – Where Are People From?

NATIONAL AND GLOBAL CHARTS ON LOCATION

BRC_Census_Location-image-9

Country of Residence

Burning Man is a global happening. Although the playa is home, Burners come from all over the country and world. 18% of our weighted population sample reside outside of the United States!

BRC_Census_Location-image-6

Canada is the most represented country from this set accounting for 7.2% of respondents. The United Kingdom and Ireland account for 3.3% and the European continent accounts for 3.6% of people.

BRC_Census_Location-image-4

The other continents are only minimally represented. Africa accounts for 0.7% of our respondents. Afrika Burn is one of the fastest growing regional burns with 8,000+ people attending in 2013. It is located in South Africa in a remote desert in the Northern Cape Province. Latin America and Africa are equally represented at the main Burn with 0.7% of the sample each despite Africa being much further away. The least represented continent is Asia with only 0.2% of total respondents.

WorldMap2

It is striking that while Black Rock City grew by 11,851 people between 2012 and 2013, this growth was not reflected in the number of visitors  from outside of the United States which remained fairly constant between the years. This may be in part due to the last minute OMG sale that took place in early August when  the BLM allowed an extra  4000 tickets to be sold. Given the late nature of this sale it would have been difficult for overseas participants to quickly acquire a ticket and prepare for the journey.  However, when even not accounting for these last minute sales,  overseas participants were not reflected in the population gains. This means that while the number of overseas participants stayed relatively the same, they became a significantly smaller percentage of the overall population in 2013.

State of Residence

Almost every state in the United States is represented in our weighted sample.

BRC_Census_Location-image-2

California is by far the primary departure point with an impressive  28,416 people or 42% of our entire sample reporting origins in the golden state. Major hubs represented by dense clusters of pink dots appear in the Bay Area, Los Angeles Area, and in Northern California near the Nevada Border. Nevada, by contrast, despite being the home of Black Rock City represents only 5% of our entire sample or 3,676 humans!

BRC_Census_Location-image-1

After California and Nevada the next most  represented state was Washington (3521) followed by New York (3353). It surprised us that more people came from New York then from other states closer to the playa such as Arizona, Oregon, and Colorado!

BRC_Census_Location-image-3BRC_Census_Location-image-8

Alaska and Hawaii are also departure points for Burners although they do not represent a large percentage of our sample. The states that were the most under-represented are also some of the furthest away, the New England states including Maine and Vermont.  Midwest States such as North and South Dakota are also  under-represented but this may be due to their overall smaller populations or to lack of participation in our samples from Burners of that region.

Written by:

Elizabeth Welsh aka Liz

Edited by:

David Nelson-Gal aka Scribble

Sociodemographic: Income

Socio-demographic Characteristics: Personal Income and Primary Earners IncomeDistribution2013

In 2013, we saw a fairly diverse socioeconomic background with a median personal income around $51,000.00

Another view into this data reveals the primary income earners compared to non-primary earners. IncomePrimarySecondary Here we see non-primary wage earners weighted toward lower income brackets but there still are many non-primary wage earners in even higher income brackets. The chart below compares 2013 data with 2012 data representing the total number of burners (not percentages). IncomeDistribution1213 We also estimated that the median income for participants went approximately from $44,000.00 in 2012 to $51,000.00 in 2013, roughly $7,000.00 increase in income. This growth in income leads to many questions. Is it related to more affluent people attending the event? What might this imply? It could also be related to a general improvement in the economy, especially in the Bay Area where a large portion of Burners are from.

A final look would be to compare the Virgin versus Veteran: In the higher income brackets, this data shows Veterans as wealthier than their Virgin counterparts; in the lower income brackets we see the opposite trend, implying that the growth in income is coming from experienced Burners and not a new population of affluent people attendingIncomeVirgins the event. This could be another symptom that an improved economy is helping existing Burners. It could also be associated with the simultaneous increase in age year over year as people deeper into their careers tend to have higher incomes. Further research would be required to get deeper into this question.

Written by: David Nelson-Gal aka Scribble

Edited by: Tabitha Palmer aka Tabicat

Sociodemographic: Gender

The data on the Black Rock City population’s gender changed slightly from 2012 to 2013, representing a possible shift towards more gender balance, including a slightly higher proportion of females among virgins.

BRC Census Blog 2013 Gender Balance v2

Females made up a higher proportion of the burner population, increasing somewhat between 2012 and 2013, from 37.9% of the population to 40.7%, while males decreased as a proportion of the total population, from 60.6% of the population in 2012 to 57.7% of the burner population in 2013. Individuals choosing “fluid” as their gender maintained a level of 1.5% of the total population of Black Rock City in both years.

GenderDeltas-1

Between virgins and veterans, there is also a higher proportion of females than that of the population as whole in 2013, which could suggest a trend toward a more equal gender balance among those who are attracted to the event for the first time.

Gender1213

Written by:

Betsy Nolan aka Betzle

Edited by:

Tabitha Palmer aka Tabicat

Sociodemographic: Age

Black Rock City’s population increased by 24% from 2012 to 2013, and experienced a consequent shift in demographics.  Age groupings illustrate the changes below.

Age Group Standards

19 and under

20-24

25-29

30-34

35-39

40-49

50-59

60 and over

After determining the percentages of these groups within our whole community, we saw groups aging over 30 years increase slightly in attendance while younger groups’ attendance decreased. The 40-49 year age group grew the most – this group experienced a 2.12% growth.  The 20-24 year old group experienced an inverse phenomenon.

As the population of Burning Man has increased in age overall, the mode and median have remained consistent by age group, shifting only slightly within designated age groupings.  The mode from both 2012 and 2013 is the 25-29 year age group.  Similarly, the median has remained within the 30-34 year group, increasing from 32.5 to 33.5 years old. With age representing a right skew, the mean age has remained higher than the latter numbers. The average has hovered closer to the 34 and 35 year mark.

AgeGroupWritten by:

Veronica Santistevan

Edited by:

Tabitha Palmer aka Tabicat

Weighting the Census: Extra Info for Burning Nerds

[If you don’t care too much about the technical stuff, you might skip this section.]

What is the purpose of the random sampling?

  • Individuals who do and do not complete the main survey may differ in certain ways, presenting a challenge for those of us trying to accurately represent the BRC population. This problem is called a self-selection bias and it happens with any survey based on voluntary participation.
  • It is possible to correct the biases due to self-selection if we have access to unbiased estimates of the surveyed population by statistically calibrating the sociodemographic characteristics of a sample to reflect the unbiased values for the population. This is called a weighting procedure.
  • In national surveys, the national census is used as a reference to weight (i.e., adjust) each survey. In our case, the random sample at the gate provides the unbiased assessment of our population.
  • Thus, the accuracy and reliability of the Census results was greatly improved by adding a random sampling procedure.

Comparison of the Weighted and Unweighted Results

The following graphs illustrate the difference between the weighted results (based on the random sampling) and the data from the main (online) survey only.

How to read the graphs:

  • The PINK bars represent the weighted results based on the random sampling.
  • The GRAY bars represent the unadjusted results from the online survey.

CensusBlog2014-04-21-image-4

Comparisons of Variables Used to Adjust the Online Survey

CensusBlog2014-04-21-image-2

CensusBlog2014-04-21-image-6

CensusBlog2014-04-21-image-1

CensusBlog2014-04-21-image-3

Main Highlights from the Comparisons

  • The differences between the results from the random sampling and the online survey show that those who completed the online survey were slightly different from those who abstained: Women and US citizens were more likely to complete online survey, while virgins and individuals younger than 20 years old were less likely.
  • The differences were not extreme, but presented a significant bias in our assessment of the BRC population.

Only the weighted results will be presented in remaining posts of the series, as they are our best estimate of the BRC population.

Written by:
Dominic Beaulieu-Prévost aka Hunter
Edited by:
Tabitha Palmer aka Tabicat
Graphs made by:
David Nelson-Gal aka Scribble

Introduction to the 2013 Census Blog Post Series

Volunteering for the random sample team can be a great playa experience. You see the city from a different angle, go beyond the gates with your team, and you are the first person that incoming citizens meet when they enter. This year, the Black Rock City Census team had a great time on the playa! We continued our operations from the Census Lab, initiating some new projects and engaging dozens of fantastic new volunteers.

The 2013 Black Rock City Census consisted of two main components:

  1. We randomly sampled burners at the gate before, during, and after the event. Randomly sampled burners completed a short, 8-question version of our census survey.  In total, we sampled 1,562 individuals in 674 vehicles, which was a great improvement over the 1,050 individuals in 470 vehicles randomly sampled in 2012. As a trial, we also conducted an exodus random sample for the first time in census history!
  2. This year, we did not distribute an on-playa census survey. Instead, burners who participated completed the long version of our census survey online after the event. At first, we were worried that burners might forget to fill out the census after the burn. However, more than 11,919 Burning Man participants completed our census online this year (1 in 5.5 citizens)!

We used the data collected during the random sample to statistically weight the data collected from the voluntarily online (convenience) sample. The implementation of this online census saved months of data entry and yielded a similar amount of reliable data. These methods, together, ensured that our findings would avoid potential biases, accurately representing the Burning Man population.

In the next few weeks, we’ll publish a series of blog posts presenting the most important results of the 2013 census. In each post, a member of the Census Lab will present and comment on the results from one section of the survey, so stay tuned for results! Feel free to contact us at census@burningman.com if you have any questions, comments, or if you are interested in being involved with our census team.

One of our teams of random samplers

Team Photo

Written by:

Autumn Albers and Steven Crane aka Indiana (in collaboration with Dominic Beaulieu-Prévost aka Hunter)

Edited by:

Tabitha Palmer aka Tabicat